The Net Contribution Growth Current Quarter versus Prior Quarter and Year Over Year page provides an overview of the net contribution data included in the graphs on the following three pages. This data includes the following categories:
- Deposits, Loans, Customers
- Deposit
- Consumer
- Commercial
- Loans
- Consumer
- Commercial
- Deposits By Product
- Consumer
- Commercial
- Loans By Product
- Consumer
- Commercial
Net Contribution Growth: Deposit, Loan and Customer Categories
The Net Contribution Growth: Deposit, Loan and Customer Categories page displays two double bar graphs that illustrate the net contribution growth for deposit, loan and customer/member product categories. The graph at the top of the page compares the current quarter to the prior quarter. The graph at the bottom of the page compares the current quarter to the same quarter in the previous year.
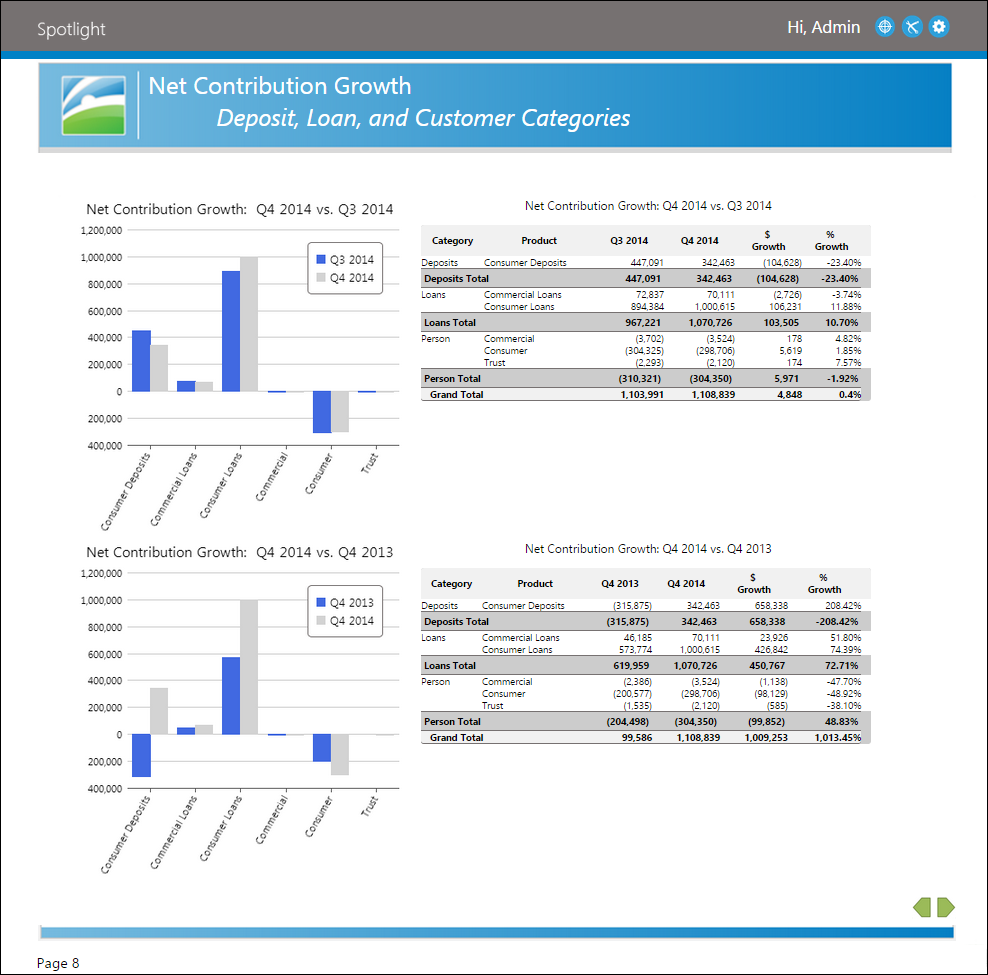
Within these graphs, the x-axis indicates the product categories included in the comparison. The y-axis indicates the product volume. The dual bars indicate the volume of contribution.
- The blue bar represents the prior quarter.
- The grey bar represents the current quarter.
To the right of the graphs, an associated table displays the following net contribution data:
| Column | Description |
| Category | Indicates whether the product is a deposit, loan or person. |
| Product | Indicates the product type. |
| Prior Quarter (Q1-4 YYYY) | Indicates a product's net contribution for the prior quarter. |
| Current Quarter (Q1-4 YYYY) | Indicates a product's net contribution for the current quarter. |
| $ Growth | Indicates the monetary difference between the current and prior quarters' net contribution. Growth $ = Current Quarter - Prior Quarter |
| % Growth | Indicates the percentage difference between the current and prior quarters' net contribution. (Current Quarter - Prior Quarter) / Prior Quarter |
Net Contribution Growth: Deposit Products
The Net Contribution Growth: Deposit Products page displays two graphs that illustrate the net contribution growth for deposit products. At the top of the page, a double bar graph compares the current quarter to the prior quarter. At the bottom of the page, the graph compares the current quarter to the same quarter in the previous year.
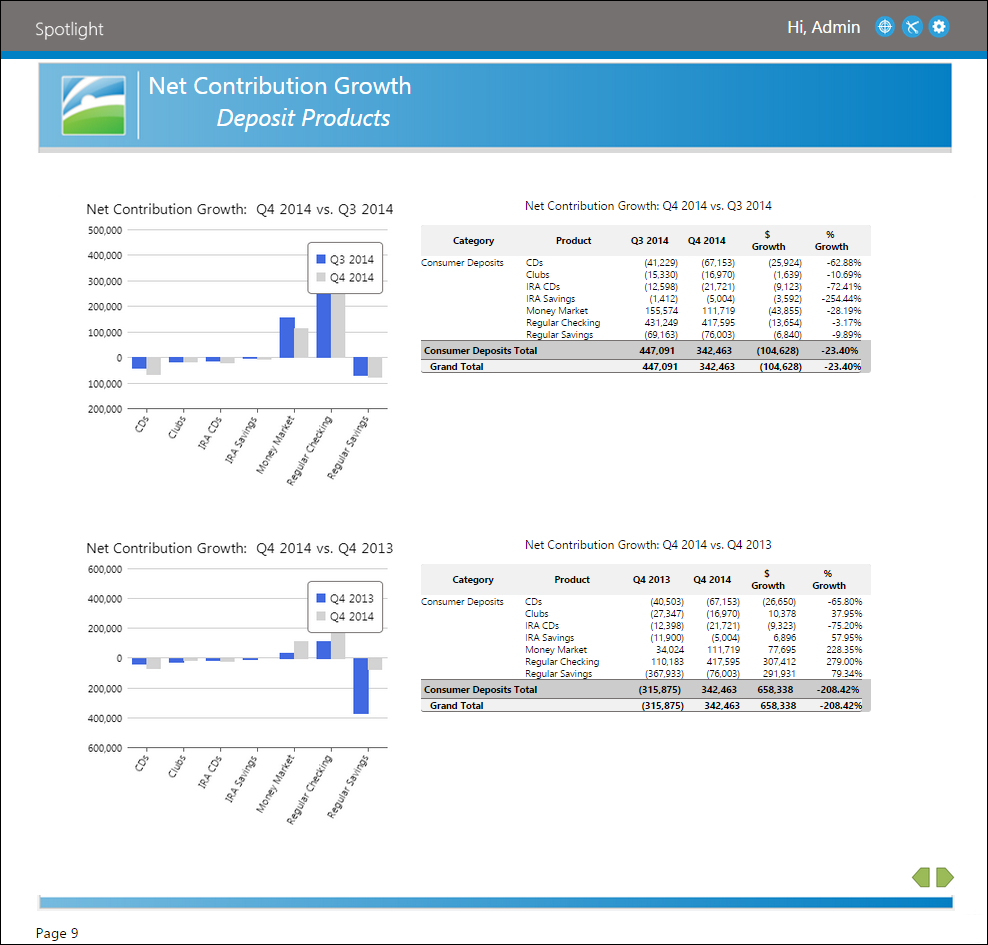
The x-axis indicates the product included in the comparison. The y-axis indicates the product volume. Within the graph, two bars indicate the volume.
- The blue bar represents the prior quarter.
- The grey bar represents the current quarter.
To the right of the graphs, an associated chart displays the following net contribution data:
| Column | Description |
| Category | Indicates the category which the deposit product belongs to. For example: consumer and commercial deposits |
| Product | Indicates the product type. For example: CDs and Money Market |
| Prior Quarter (Q1-4 YYYY) | Indicates a product's net contribution for the prior quarter. |
| Current Quarter (Q1-4 YYYY) | Indicates a product's net contribution for the current quarter. |
| $ Growth | Indicates the monetary difference between the current and prior quarters' net contribution. Growth $ = Current Quarter - Prior Quarter |
| % Growth | Indicates the percentage difference between the current and prior quarters' net contribution. (Current Quarter - Prior Quarter) / Prior Quarter |
Net Contribution Growth: Loan Products
The Net Contribution Growth: Loan Products page displays two graphs that illustrate the net contribution growth for loan products. At the top of the page, a double bar graph compares the current quarter to the prior quarter. At the bottom of the page, the graph compares the current quarter to the same quarter in the previous year.
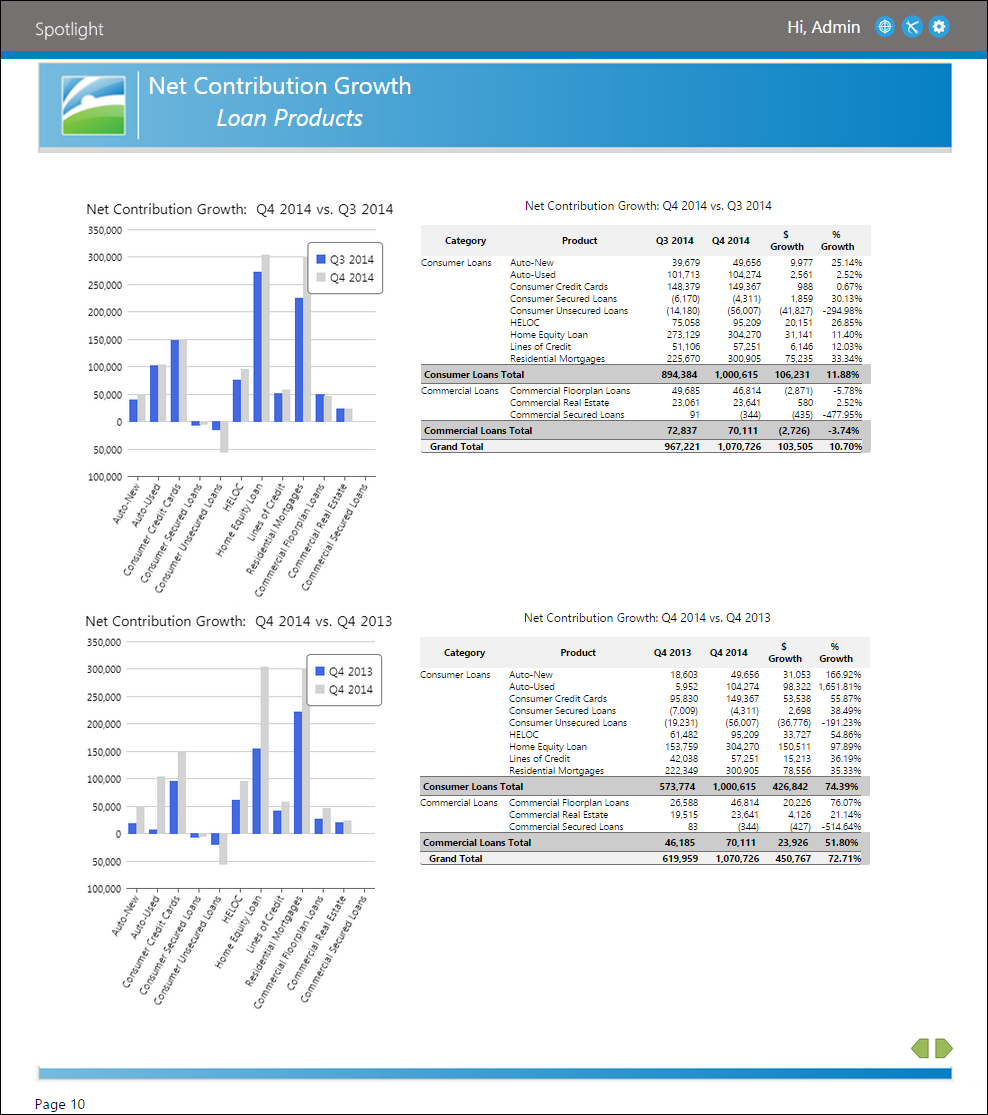
The x-axis indicates the products included in the comparison. The y-axis indicates the product volume. Within the graph, two bars indicate the volume.
- The blue bar represents the prior quarter.
- The grey bar represents the current quarter.
To the right of the graphs, a chart displays the following net contribution data:
| Column | Description |
| Category | Indicates the category which the deposit product belongs to. For example: consumer and commercial loans |
| Product | Indicates the product type. For example: Auto-New and HELOC |
| Prior Quarter (Q1-4 YYYY) | Indicates a product's net contribution for the prior quarter. |
| Current Quarter (Q1-4 YYYY) | Indicates a product's net contribution for the current quarter. |
| $ Growth | Indicates the monetary difference between the current and prior quarters' net contribution. Growth $ = Current Quarter - Prior Quarter |
| % Growth | Indicates the percentage difference between the current and prior quarters' net contribution. (Current Quarter - Prior Quarter) / Prior Quarter |