Elements contains over 30 predefined reports that are included with an install of the system. These reports contain information regarding a majority of the functions in Elements such as the download and promises made on accounts. In addition to the strong reporting capabilities included out-of-the-box, administrators can take advantage of Elements' robust report builder to create user-defined reports. Reporting is integrated with Microsoft SQL Server Reporting Services, which allows users to format reports and select various output formats.
An unlimited number of user-defined reports can be created. They can be run on-demand or can be scheduled to run automatically at certain times. Scheduled reports can also be automatically emailed to users after they are generated.
All reports are accessed from the Reports tab on the Elements Home Dashboard.
 |
Access to individual reports is controlled through Security Profiles. |
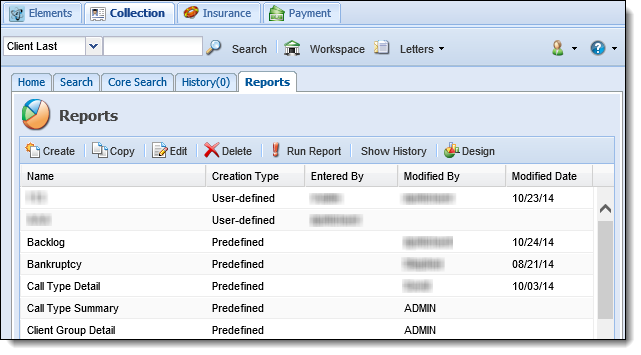
The Reports tab displays the following information.
| Column | Description |
| Name | Displays the name of the report. |
| Creation Type |
Displays the type of report.
|
| Entered By | If the report is user-defined or custom, displays who created the report. This is empty for predefined reports. |
| Modified By | Displays who last modified the report. |
| Modified Date | Displays the date the report was last modified. |
Listed below are the report attributes and the actions that can be taken while managing reports in Elements.
- Report Attributes
- Creating a Report
- Running a Report
- Editing a Report
- Copying a Report
- Deleting a Report
- Report History
- Report Designer
Report Attributes
All reports are comprised of the same attributes, separated into tabs.
General
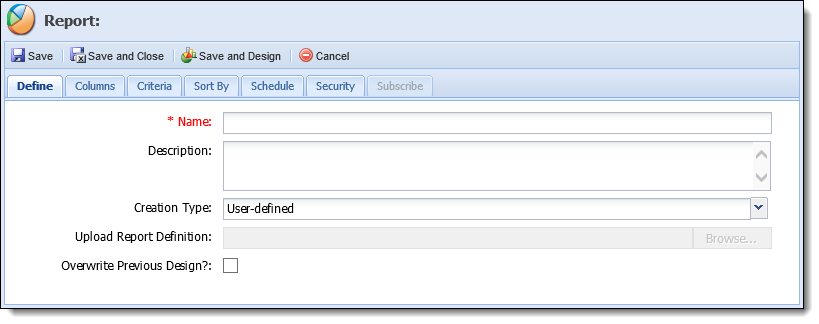
General attributes contain the basic information pertaining to the report and are defined on the Define tab.
| Attribute | Description | ||
| Name | Enter a name for the report. This field is required. | ||
| Description | If desired, enter a detailed description of the report. | ||
| Creation Type |
Select User-defined from the drop-down.
|
||
| Upload Report Definition | Enter or browse to the location of the RDL file. This field is only enabled if Custom is the selected Creation Type. | ||
| Overwrite Previous Design? | Select this checkbox if editing an existing user-defined report. |
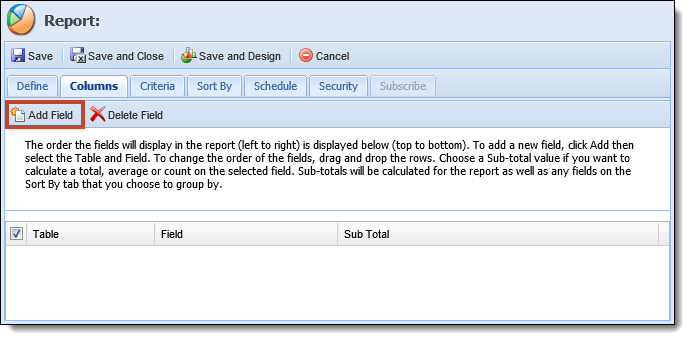
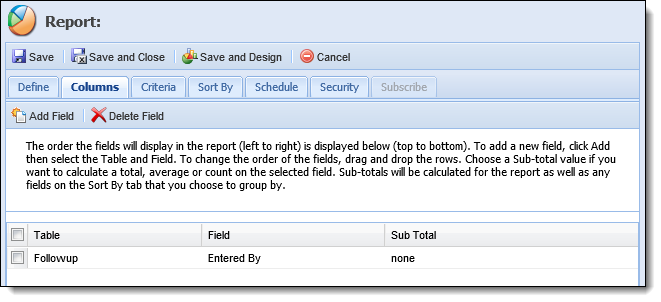
Columns
Column attributes define the fields to display in columns on the report, the order in which columns are listed and if any field values should be counted or subtotaled.
To add a new column, click Add Field.
The Add Table and Field window is displayed.
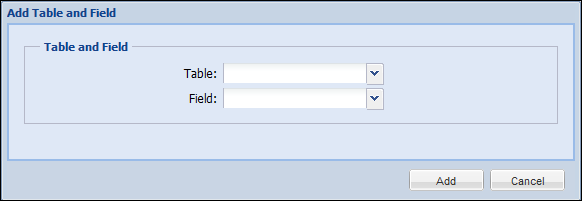
Select the column field to add to the report using the fields defined below.
| Field | Description | Image | ||
| Table |
Select the database table in which the desired field resides.
|
 |
||
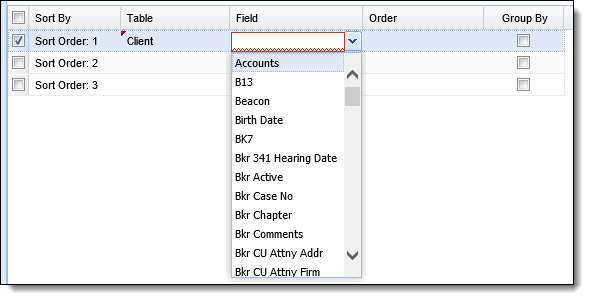
| Field | Select the field to appear in a column on the report. This drop-down displays different fields depending on the Table chosen. For example, if Client is the selected Table, only client-level fields appear. |  |
When the desired field is selected, click Add. Click Cancel to disregard adding the field.
The field appears on the list of fields in the Columns tab.
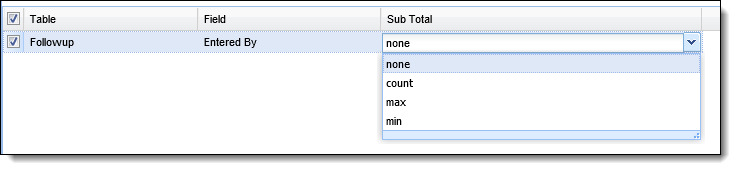
To include a calculation of the field on the report, click none in the Sub Total column. A drop-down displays listing the available calculation options: none, sum, average, min, max and count.
|
The options available in the Sub Total drop-down vary depending on the field selected. |
Click to highlight the desired calculation option. When the report is generated, this value is calculated for each group, sub-group and for the entire report.
Continue adding column fields until all desired column fields have been added to the report.
|
Each time the Add Field button is clicked, Elements assumes that a new field will be added from the table that was previously selected. To select a different table, delete the text in the Table field and either start typing the new table name or use the drop-down list to select the new table. When the new table is selected, the Field list refreshes to correspond with the selected table. |
The order (top to bottom) the fields are displayed on this tab is the order they are displayed (left to right) on the report. Rearrange the order of the columns by clicking to highlight the desired column field and dragging it up or down in the list of fields.
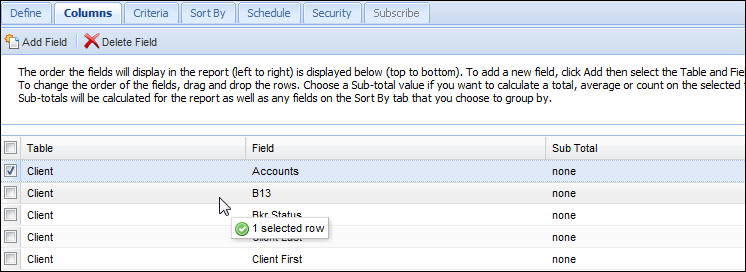
To delete a column, click the checkbox next to the desired field column and click  .
.
Criteria
Criteria attributes define the rules that loans, clients and contacts must meet in order to be included in the report results.
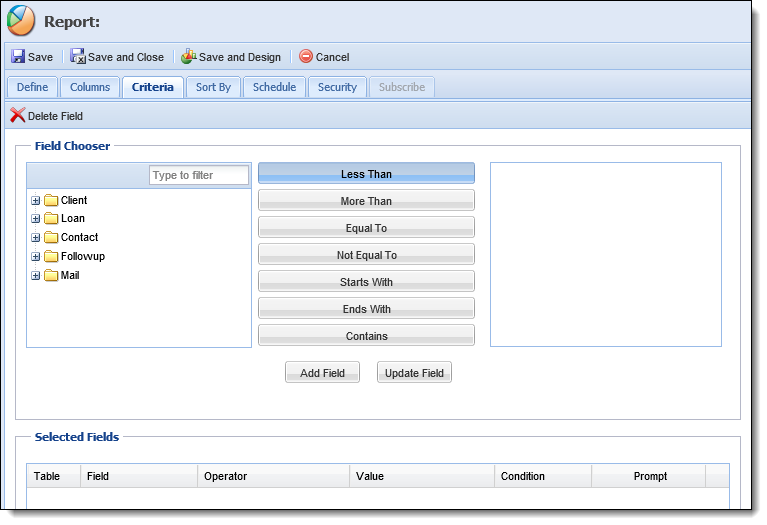
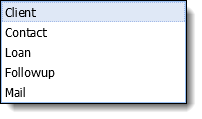
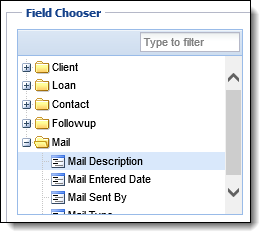
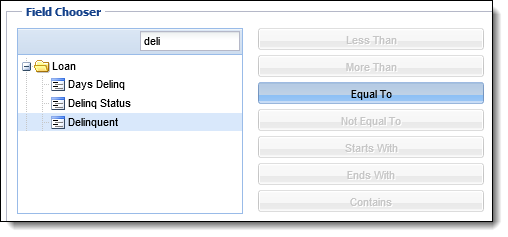
To add a new line of criteria, expand the Client, Loan, Contact, Followup or Mail folders, or search for the field by entering any search text into the filter box and hitting Enter on the keyboard. Once the desired field has been found, click to highlight it.
Next, select an operator. The available operators are adjusted based on the selected field. For example, Equal To is the only operator available for flag fields such as the Delinquent flag.
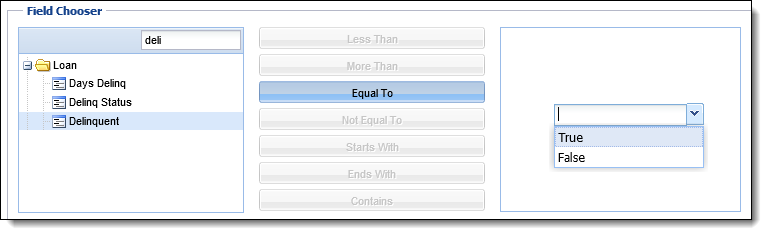
After the field and operator are selected, enter or select the value of the field in the value section of the criteria builder. The field and operator drive the value that can be added to the criteria. For example, if using a date field, a calendar displays in the value section to select a specific date, or range of dates, from. If using a flag field, a True/False drop-down displays in the value section as shown below.
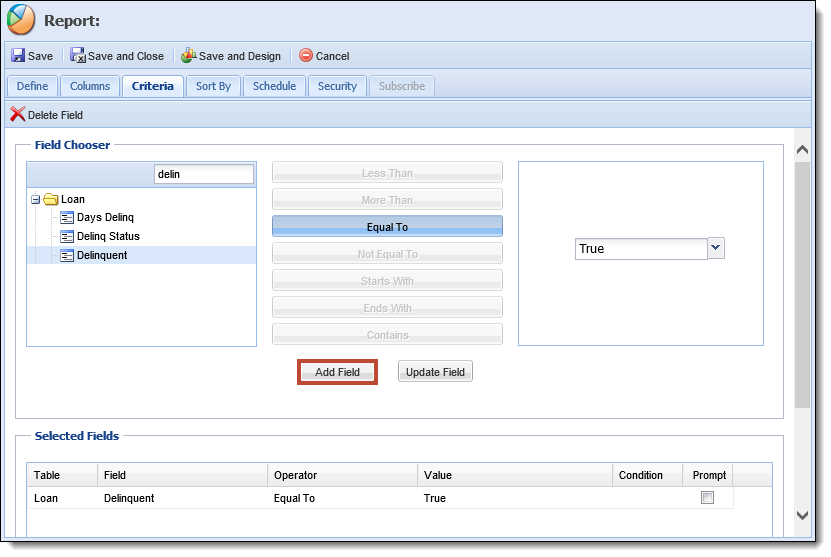
Enter or select the value and click Add Field. The field is added to the list of Selected Fields.
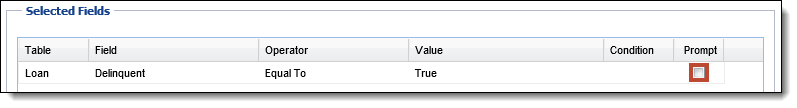
Select the Prompt checkbox to prompt the user to input a value when the report is generated. If this is not selected, the value defined for the field on this tab is used when the report is generated.
|
Rather than creating multiple reports for a similar purpose, prompt could be selected to allow for the same report to define different results. |
Continue adding criteria until all desired criteria is added to the report. To update an existing line of criteria, click to higlight the criteria in the Selected Fields section, use the Field Chooser to modify the criteria and click Update Field. To delete an existing line of criteria, click to highlight the criteria in the Selected Fields section and click .
|
At least one Loan field must be included in the criteria to have loan details appear in the report results. For example, if the criteria is "Client State Equal to AZ," all of the clients in Arizona appear in the results, but none of their loans appear. If the criteria is "Client State Equal to AZ AND Current Balance More Than 0," all of the loans each client has where the balance is greater than zero appear in the results. |
By default, the lines of criteria are joined together with an "AND" condition, meaning that all of the criteria would need to be true in order for a loan, client or contact to be included in the report results. Click in the Condition column of the desired field to change the condition to "OR" or "GROUP" as appropriate.

Use the table below to select the appropriate condition.
| Condition | Description |
| AND | Select AND if both the current line of criteria and the next line must both be true. |
| OR | Select OR if either line of criteria can be true. |
| GROUP | Select GROUP to bundle more than one line of criteria together. Please see the Grouping Criteria section below for more information. |
Grouping Criteria
Create more sophisticated report criteria by using the Group condition. Grouping can be used to create a report in which several conditions must be true and one of several other conditions must also be true.
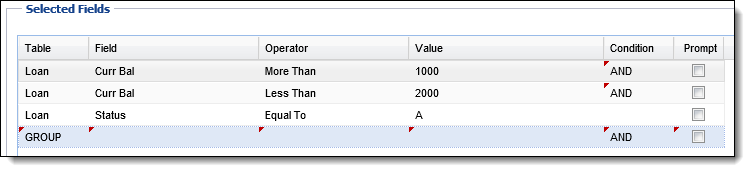
For example, an administrator wants to create a report on all active loans with a balance between $1,000.01 and $1,999.99 that are delinquent or locked.
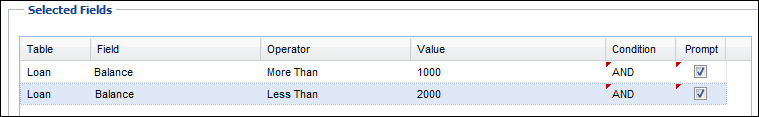
Specify the balance restriction first by creating criteria for "Curr Bal More Than 1,000" and "Curr Bal Less Than 2,000." Link these lines together with an AND condition. This means that both criteria must be met.
Add the "Status Equal to Active" criteria. In the Condition column, select GROUP to add a group division line. On the Group line, select AND to signify that the criteria above the group line and below the group line must both be met.
Add the "Loan Delinquent Equal to True" and "Loan Locked Equal to True" criteria. Change the Condition on the Delinquent line to OR. This states one or the other line of critera must be met (the loan must be delinquent OR locked).
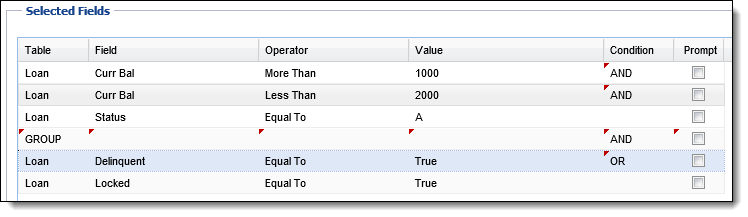
When the report is generated, active loans that are delinquent or locked and have a balance between $1,000 and $2,000 are included. Inactive or Charged-off loans with balances between $1,000 and $2,000 are not included, nor are non-delinquent or unlocked loans.
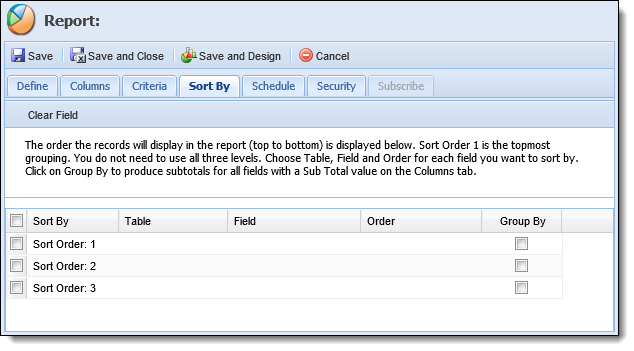
Sorting
Sorting attributes define the order in which results are listed on the report. By default, results are displayed in increasing client number order, but up to three custom sort conditions can be defined. For example, the sort order could be set up to display report results by the client's branch, then loan type, then client's last name.
In the Sort Order: 1 row, click in the Table column to select the database table in which the desired sort field resides.
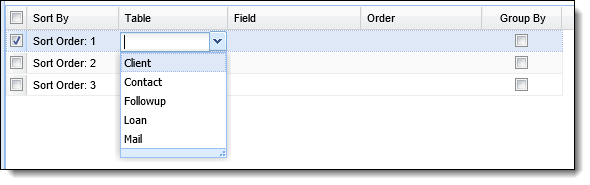
Click in the Field column to select the desired sort field.
|
If Client is the selected table, only client-level fields, such as client name and address, display in the Field drop-down. |
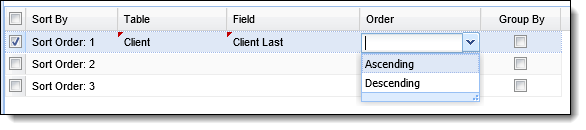
Click in the Order column to select either Ascending or Descending sort order.
|
A-Z is Ascending order. Z-A is Descending order. |
Select the Group By checkbox to group the report results by the selected field.
|
Any fields identified on the Columns tab that have associated calculations, such as count, sum or average, are calculated for each Group. |
Repeat for Sort Order 2 and 3, if desired.
Schedule
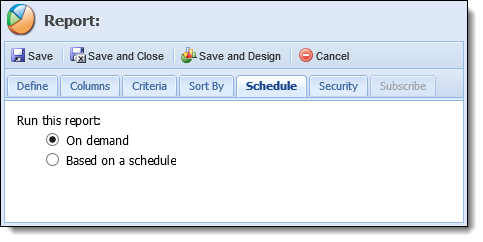
Schedule attributes define when the report is generated. On the Schedule tab, select On demand for the report to be manually generated by administrators or Based on a schedule for the report to be automatically generated at a specified time.
|
Scheduled reports that have been previously generated can be viewed and regenerated at a later time. |
If Based on a schedule is selected, the following schedule attributes appear for selection.
|
The available schedule options vary depending on the frequency chosen (hourly, daily, weekly or monthly). The below example shows a report generated each weekday (Monday through Friday) at 5am. |

|
To schedule a report to generate months-end data, schedule it to run on the 1st of the month before the download is scheduled to start. |
 |
Do not place a report on a schedule if it is configured to prompt users to input a criteria value at run time. If a report is scheduled to run and a user is not available to input a criteria value, the report does not generate. |
Security
Security attributes define the security profiles that have access to run the report. By default, a user-defined report is automatically available to all users who share the same security profile as the user who created the report.
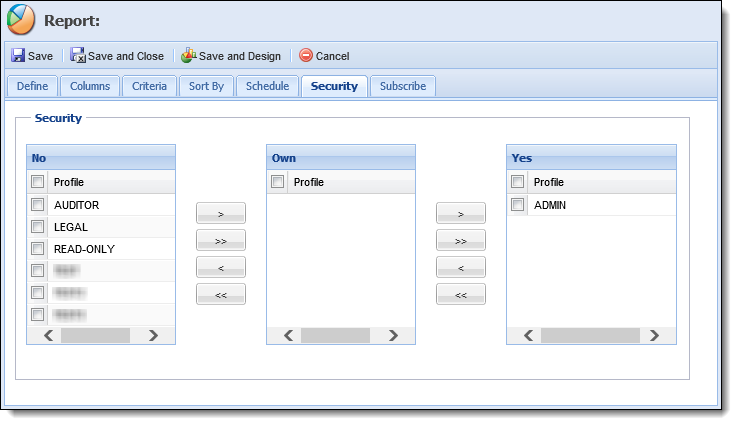
To adjust report access based on security profiles, click the checkbox next to the profile and use the arrow buttons to move it to the desired category. Each category is defined as follows.
| Category | Definition |
| No | Profiles in this category are not able to view or print the report. |
| Own | Profiles in this category are able to view and print the report but the results are limited to loans in their own worklists. |
| Yes | Profiles in this category are able to view and print the report without any restrictions on results. |
|
Admin users are able to modify access rights of all reports for a security profile under Security Profiles. |
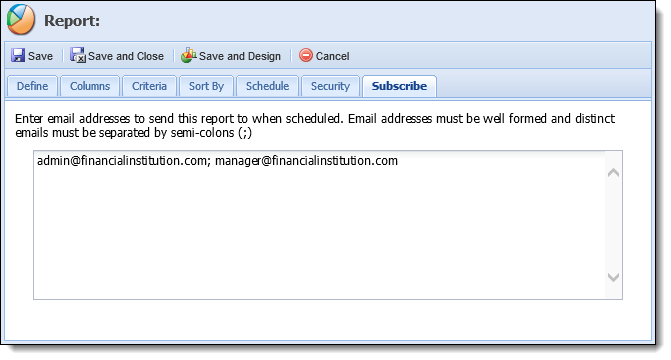
Subscribe
Subscribe attributes define the email addresses to which the report is emailed when generated on a schedule. Enter as many email addresses as desired, separating each one with a semi-colon (;).
|
This tab is only enabled when Based on a schedule is selected on the Schedule tab. |
Creating a Report
- To create a new user-defined report, click
 on the Reports tab. The report editor window displays.
Prior to creating a report, Report Server Settings must be defined in System Management. Please see the Reporting Services topic for more information.

- Enter the attributes on each of the tabs then click
 or
or  to save the new report. Click
  to disregard the new report.
Running a Report
- To run a report, click to highlight the desired report and click
 . The report is generated in a new window. At the top of the report window are filters that can be used to further define the results that display. The filters vary depending on the report that is generated. If desired, use the filter text boxes, calendar icons and drop-downs to re-define report results and click View Report to regenerate the report.
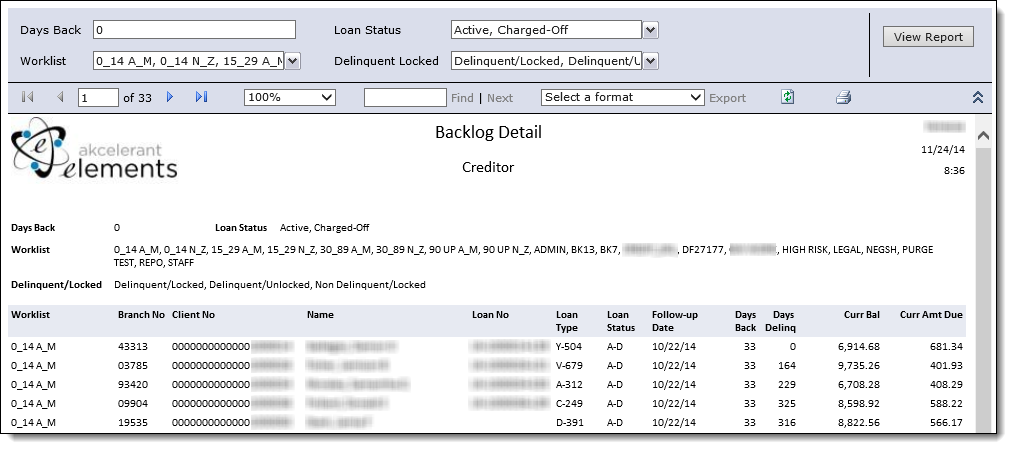
- When generated, each report also contains a toolbar that allows additional pages of the report to be viewed, the export format to be selected and the report to be printed. Use the buttons and fields defined below to work with the report.
Button/Field Description Click this button to return to the first page of the report. Click this button to return to the previous page of the report. Enter a page number in the textbox and hit Enter on the keyboard to navigate directly to a certain page of the report. Click this button to navigate to the next page of the report. Click this button to navigate to the last page of the report. Select a percentage from this drop-down to change the zoom level of the report. The zoom level is how small or large the report text appears. Enter any text into this textbox and click Find to search for a specific report result. If multiple results are found, click Next to view the next result. Select an export format from this drop-down and click Export to regenerate the report in the selected format. Options include:
Format Description XML file with report data Sends the report to an XML code webpage. CSV (comma delimited) Sends the report to Excel with each value in each record displaying in a separate cell.
By default, the Client Number and Branch Number fields have leading zeroes. When a report containing these fields is exported to CSV, these leading zeroes are removed.
To preserve the leading zeroes:
- Save the file with the extension .txt (not .csv).
- Open Excel.
- Open the file. The Text Import Wizard opens automatically.
- Specify that the file type is comma delimited.
- Specify that the Client Number and Branch Number columns should be imported as text.
- Complete the Wizard.
Sends the report to Adobe PDF Reader. MHTML (web archive) Sends the report to a webpage. Excel Sends the report to Excel without the records and values appearing in separate cells. TIFF file Sends the report to a TIFF image file. Word Sends the report to Microsoft Word. Click this button to refresh the report. The first page of the report is displayed. Click this button to print the report. 
Click these buttons to collapse and expand the report filters.


Editing a Report
- To edit an existing report, click to highlight the report and click
 or double-click on the report. The report editor window displays.
 - Select the Overwrite Previous Design checkbox on the Define tab. The report cannot be edited unless this is selected.
- Modify any attributes on the tabs then click or to save the report. Click to disregard any changes.
All attributes of a user-defined report can be modified. Only the Security and Schedule attributes for custom and predefined reports can be modified.
Copying a Report
- To copy an existing report to create a new report, click to highlight the report to copy and click
 on the Reports tab. The report editor window displays.
 - On the Define tab, give the report a new name. Modify any attributes on the remaining tabs then click
 or
or  to save the new report. Click
  to disregard any changes.
Predefined and Custom reports can be copied but only the Schedule and Security attributes can be modified. A new report created from a copy of a Predefined report becomes a Custom report.
Copying a report does not copy any enhancements made through the Report Designer. A new report must be created if enhancements have been made through the Report Designer.
Deleting a Report
- To delete a report, click to highlight the report and click
 on the Reports tab. A prompt appears confirming that the report should be deleted. Click Yes to delete the report. Click No to disregard the deletion.
Predefined reports cannot be deleted.
Report History
Each time a scheduled report is generated, a copy is saved for access and regeneration at a later time. This can serve as a snapshot of what the system looked like at a certain time, as this is not otherwise recorded.
- To access a scheduled report's history, click to highlight the report and click
 on the Reports tab.
 - A calendar appears with
 displaying on days scheduled reports were generated.
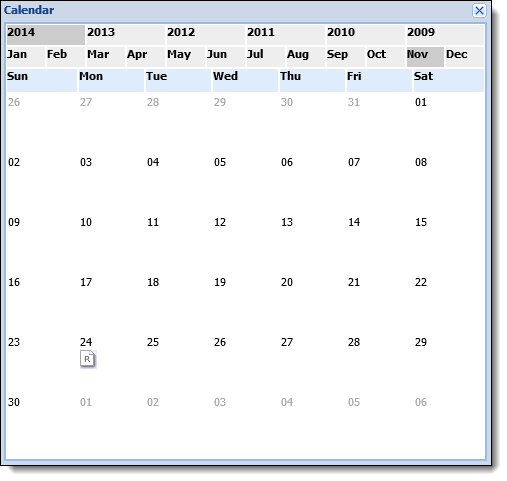
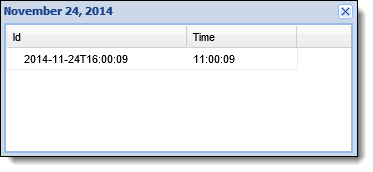
- Click the date to display a list of reports that were generated on that day. Double-click on the desired report to regenerate the report in a new window.
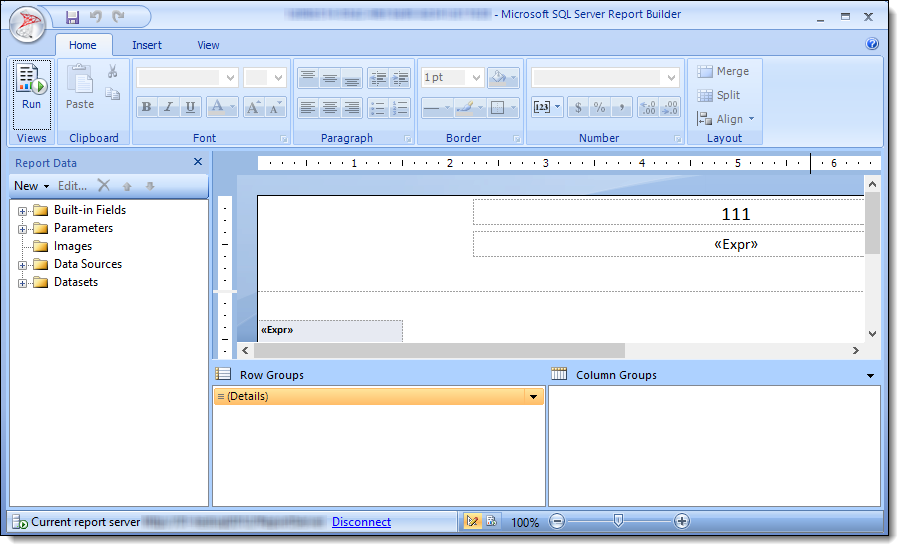
Report Designer
User-defined and Custom reports can be enhanced to include charts and graphs using Microsoft SQL Server Report Builder.
- To enhance a report with Microsoft SQL Server Report Builder, click to highlight the report and click
 on the Reports tab. Microsoft SQL Server Report Builder displays.
For more information on Microsoft SQL Server Report Builder, please reference their help documentation.