Temenos Lifecycle Management Suite - Origination Product Guide
Reports
| Administrator Guide > Desktop and Ribbon Bar > Reports |
Reporting is integrated with Microsoft SQL Server Reporting Services, which allows an administrator to format reports and select various output formats.
Users can create an unlimited number of additional reports. Reports can be run on-demand by anyone who has permission to run the report or can be scheduled to run at certain times. Scheduled reports can also be automatically emailed to specific people after they are generated. New reports can be created to view information about applications in Temenos Infinity, . Reports can accessed from the Work section in the Ribbon Bar.
Reports are classified as Standard, Predefined, or Advanced Reports.
| Report Type | Definition | ||
| Standard |
Report created by users in the Report Writer. These reports can be enhanced using the Report Builder.
|
||
| Predefined |
Report provided by Temenos or uploaded to Temenos Infinity as a custom RDL. Fields and Criteria are not available to be modified.
|
||
| Advanced |
User-created report compiled by writing or importing a query to gather data rather than using the Report Writer. Knowledge of the database structure and SQL Querying are required in order to construct these reports.
|
Clicking  in the Ribbon bar opens the Reports page.
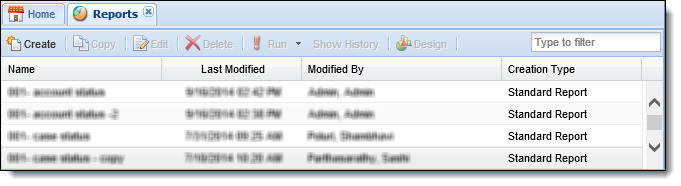
The Reports page organizes report information into the following columns:
| Column Name | Description |
| Name | The name of the report. |
| Last Modified | Denotes when the last modification was made to the report. |
| Modified By | Denotes who made the last modification to the report. |
| Creation Type | The type of report identified when the report was created. |
Temenos Infinity includes pre-defined reports for each module.
The following pre-defined reports are available for the loan and account origination modules:
| Report | Report Type | Description | ||
| All Stipulations | Detail | This report provides a list of all stipulations applied to applications. | ||
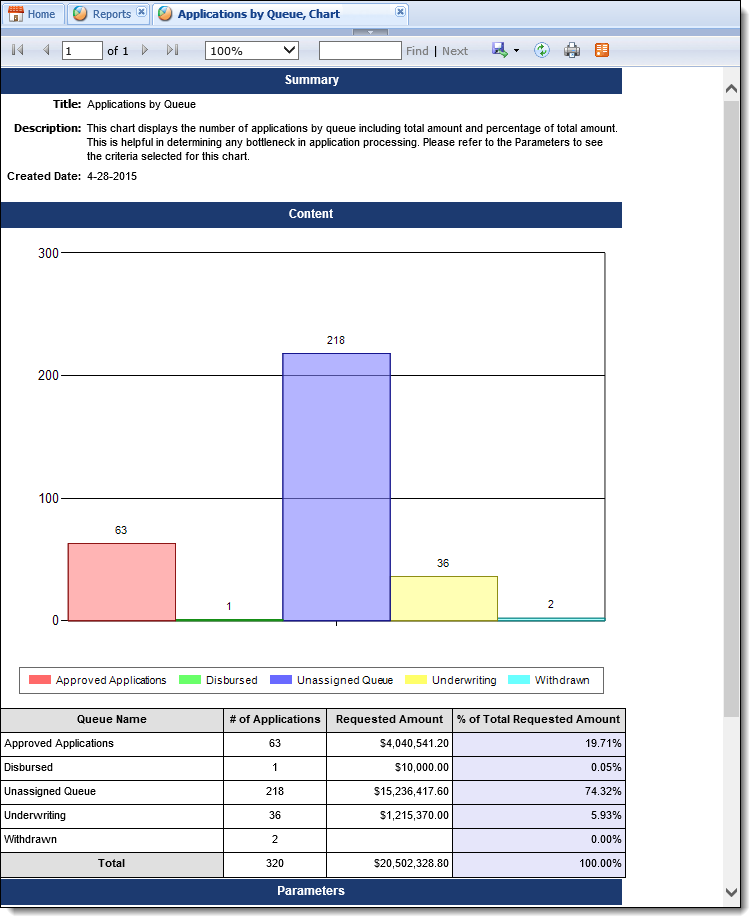
| Applications by Queue | Chart | This chart displays the number of applications by queue, including total amount and percentage of total amount. This chart is helpful in determining any bottleneck in application processing. | ||
| Audit Report by Application | Detail | This report displays audit history for a specified application. | ||
| Audit Report by User | Detail | This report displays audit history for a specified user and date range. | ||
| Counteroffer by Loan Origination | Detail | This report provides a list of all applications that have Counteroffers created. It is organized by Branch, Source, and Product: Sub‐Product. For each application, the user is able to view each counteroffer and can compare loan terms between the originally requested terms and the counteroffer terms. A ratio is provided at the end of the report that shows the Accepted Counteroffers Rate. | ||
| Cross-sell History by Date Range | Detail | This report provides a list of all sales opportunities within a specified date range. | ||
| Cross-sell Products by Revenue | Chart | This chart displays the percentage of total amount of each product sold in the cross-sell. This chart is helpful in determining the most profitable products and the best performing staff by product. | ||
| Cross-sell Products Sold by Reason | Detail | This report provides a list of all sales opportunities by reason and what products were offered and accepted. This report is helpful in determining the most profitable reason that products were accepted and the total amount of each product sold. | ||
| Cross-sell Products Sold by Risk | Detail | This report provides a list of all sales opportunities by risk tier and what products were offered and accepted. This report is helpful in determining the sold ratio for each risk tier and the total amount of each product sold. | ||
| Cross-sell Products Sold by User | Detail | This report provides a list of all loan staff sales opportunities and what products were offered and accepted. This report is helpful in determining the sold ratio for each staff member, number of sales opportunities each had and the total amount of each product sold. | ||
| Cross-sell Trends by Cross-sell Product | Detail | This report displays performance of staff resources for cross-selling products including the sold rate. This report is helpful in identifying high performers for cross-selling as well as those who need additional assistance. | ||
| Cross-sell Trends by User | Detail | This report displays performance of staff resources for cross-selling products including the sold rate. This report is helpful in identifying high performers for cross-selling as well as those who need additional assistance. | ||
| Current Applications by Queue | Detail | This report displays, by risk tier, the time opened and time in current queue for each queue’s total of applications as well as for each application. This report is helpful in determining any bottlenecks in processing applications and ensures a quick delivery of better paper grade loans. | ||
| Debt Protection Offered by Product | Detail | This report displays loans by risk tier and whether insurance products were offered and accepted, as well as it identifies the total amount of insurance sold. This report is helpful in identifying the percentage of loan coverage, particularly for lower paper grade loans. | ||
| Disbursed Amount by Risk | Chart | This chart displays the percentage of new loans by risk type for a specific time period, by a specific branch, or by a combination of branches. This chart is helpful in identifying the exposure of new loans by risk. | ||
| Disbursed Applications by MSR | Detail | This report provides a list of all new loans disbursed by the institution’s Service Representative for a specific date range. This report is helpful in determining the production of each Service Representative for a time period. | ||
| Disbursed Applications by Loan Officer | Detail | This report provides a list of all new loans disbursed by the approving Loan Officer for a specific date range. This report is helpful in determining the production of each Loan Officer for a time period. | ||
| Disbursed Applications by Originator | Detail | This report provides a list of all new loans disbursed by the approving Loan Officer for a specific date range. This report is helpful in determining the production of each Loan Officer for a time period. | ||
| Hours Application by Risk | Detail | This report displays how long applications have been opened, according to risk tier. This report is helpful in identifying the better paper grade loans in order to get them booked quicker. | ||
| Loan Originations by Expiration Date | Detail | This report provides a list of all applications that have an expiration date. It is organized by Branch, Source and Product: Sub‐Product. For each application, the user can view the applications with the closest expiration date at the top. By default, the report displays the applications set to expire within the next 90 days. | ||
| Loan Product Declinations by Product | Detail | This report provides a list of all declined loan applications by date range according to the product. This report assists in understanding the reason for an application’s rejection. | ||
| Loan Product Declinations by Product and Source | Detail | This report provides a list of all declined loan applications by date range according to the product and the source of the application. This report assists in understanding the reason for an application’s rejection. | ||
| Loan Product Originations by Branch and Status | Detail | This report provides a list of all applications originated by date range, branch, status, and product. This report assists in understanding the distribution of new applications by branch. | ||
| Loan Product Originations by Branch | Detail | This report provides a list of all applications originated for a date range by branch. This report assists in understanding the distribution of processing new applications by branch and how to best assign resources. | ||
| Loan Product Originations by Product and Risk | Detail | This report provides a list of all applications originated for a date range by application type and risk tier. This report assists in understanding the potential loans by product type and current status, as well as identifies the quality of new applications by risk tier for each application type. | ||
| Loan Product Originations by Product | Detail | This report provides a list of all applications originated for a date range by application type. This report assists in understanding the potential loans by product type and current status. | ||
| Loan Product Originations by Risk | Detail | This report provides a list of all applications originated for a date range by risk tier. This report assists in understanding the quality of new applications by risk tier for each application type. | ||
| Requested Amount by Product | Chart | This chart displays the percentage of total number of applications for a period of time by status, branch, originator, and application type. This chart is helpful in determining how decision models are performing for application types or how originators’ applications are performing. | ||
| Requested Amount by Status | Chart | This chart displays, by status, the percentage of total requested amount for a period of time for selected application types, branches, and originators. This chart is helpful in identifying how loans originated by certain individuals resulted in possible loans. | ||
| Requested Amount, Percentage by Branch | Chart | This chart displays the percentage of the loan requested amount for each originating branch. This chart is helpful in determining each branch’s performance relative to the overall amount of new applications being originated. | ||
| Risk Disbursement by Branch | Summary | This report provides a list of the total loans disbursed by each branch according to risk. It displays the total number and total amount of each paper grade, as well as percentage of total for each branch. This report is helpful in determining the quality of loans that each branch produces. | ||
| Risk Disbursement by Loan Officer | Summary | This report provides a list of the total loans disbursed by each loan officer according to risk. It displays the total number and total amount of each paper grade, as well as percentage of total for each loan officer. This report is helpful in determining the quality of loans that each loan officer produces. | ||
| Risk Disbursement by Risk Tier | Summary | This report provides a list of the total loans disbursed within each risk tier. It displays the total number and total amount of each paper grade, as well as percentage of total for each risk tier. This report is helpful in determining the quality of loans being produced. | ||
| Stipulations by Application | Detail | This report provides a list of all stipulations applied to applications. The current status of each stipulation is displayed. | ||
| Stipulations Outstanding | Detail | This report provides a list of all outstanding stipulations applied to applications. The current status of each stipulation is displayed. | ||
| Time in Current Queue by Queue | Summary | This report displays, by queue, the total number, percentage of total number, total amount and percentage of total amount for each application, broken into time intervals spent in the current queue. This report is helpful in identifying any bottlenecks within the queues. | ||
| Time Since Created by Queue | Summary | This report displays, by queue, the total number, percentage of total number, total amount and percentage of total amount of applications, broken into time intervals since the application originated. This report is helpful in identifying any bottlenecks within the queues. | ||
| Vendor Statistics Report | Chart |
This chart displays a statistical view of the number of applications submitted from a vendor according to risk tier. This report is helpful in determining the quality of loans produced by each vendor configured in Vendor Management.
|
The following Core reports are classified as General, but are available for all modules.
| Report | Description |
| Data Dictionary | This report provides a list of the fields within a particular list identifying the Long Display (the folder path to locate) along with details about the field itself. The search option can also be used to locate a specific field. |
| Maintenance Audit Report | This report records all changes made to User Permissions and Security Groups, noting what the Action was (Adding/Removing a Group, Adding/Removing a User, Changing Permissions), who made the change, when the change was made, and the specifics of the change. By default, the report returns all audits for the current month, but the date range can be changed at run time. |
| RuleApp Difference Report | This report compares two versions of the rule application within the database for differences in both business rules and decision tables. If a difference is detected, the rule's previous logic and new logic is displayed within this report. For more information, refer to the Rule Application Difference Report topic. |
| Security Groups | This report provides a list of the sections in which security permissions are established along with the current settings in each security group (none, view, change). Additionally, Administrators are able to view a user’s current activity, as well as their time of last log in. |
| Security Group Permissions | This report provides institutions the ability to identify the permissions and users within one or more Security Group. The data within this report contains a list of all users within the Security Group(s) and the users' permissions. |
| System Tools Usage Report |
This report provides institutions the ability to identify dashboards, letters, reports, views, and workflows that have not been used since a specific date. When this report is run, users are presented with a toolbar that enables them to define the Last Used Date for the report, and determine if the report includes a record of the tools with an empty Last Used Date. |
| User Permissions | This report provides the User Information, Security Groups, Permissions, Restrictions, and Lending Settings at the individual user, all users, and Security Group levels. The data within this report contains user data from the User Information, Security Groups, Permissions, Restrictions, and Lending Settings tabs within System Management > Users. |
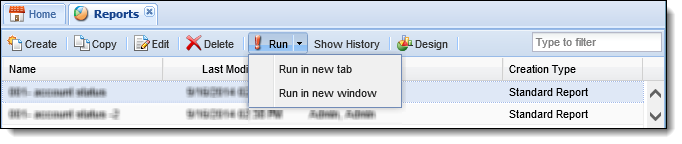
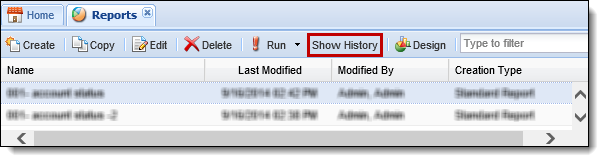
From the Reports page, users with appropriate permissions can create reports, copy reports, edit reports, delete reports, run reports, and view report history.
 |
The Design option is only enabled for advanced report building. For more information on this feature, contact a Temenos Account Manager and/or refer to the Advanced Report Builder help section of the user guide. |
 drop-down. Reports can either be opened in a new tab or new browser window.
|
If a user attempts to view a report, without the proper permissions, he or she will receive and Insufficient Permissions error message. |
Reference the following list for an overview of tips to consider for certain filters, or required fields, that may appear to run a report:
- A Vendor Id must be entered to return results in a Vendor report.
- When a report is configured to prompt the user to enter a date range, the End Date range assumes a time of 00:00:00 if a time is not appended to the end date. To ensure information for the desired end date is included within the report, add a time in 00:00:00 format to the End Date or select a date that is one day ahead of the desired end date. For example, if a report is to include information from 4/1/2015 to 4/28/2015, in order to ensure information for 4/28/2015 is included, a date range of 4/29/2015 or 4/28/2015 11:59:59 PM must be entered as shown in the below example:

 in the report ribbon bar.
 in the report ribbon bar.
Reference the following list for an overview of tips to consider when printing a report in Temenos Infinity:
- When using Internet Explorer 10 and SQL 2008 R2 RTM, trying to print a report causes the Internet Explorer browser to refresh and close the previous session. To resolve this issue, an upgrade to SQL 2008 R2 SP2 must be performed by the financial institution.
- When printing a PDF of a report, the columns of the report do not print within one page if the content is wider than the page width, even when the Shrink to Fit print setting is enabled.
 in the report ribbon bar.
 |
Reference the list below for an overview of behavior that may occur for certain fields when a report is generated:
|
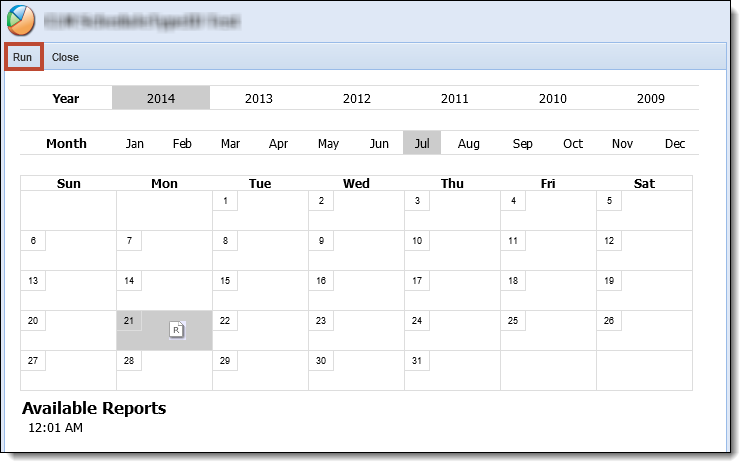
The report history is available for reports that are setup to run based on a schedule.
|
There is no timeframe for how a long a scheduled report is available to be viewed as historical reports do not expire. |
|
For more information on report configuration, please see the Reports Administration topic in the Administrator Guide. |
 Origination Reports